Channel mixer
The channel mixer allows you to make level adjustments and redirect audio signals from their original channel assignments to new ones. For instance, you can use the mixer to condense separate stereo channels to a left or right mono channel.
If you need functions the channel mixer does not provide, consider applying the Channel Tool effect to the clip. See Audio effects for information about the Channel Tool.
Level adjustment: Click on the slider under the level meters to set the playback level of the clip. The level you set will be used whenever this clip is played or used in a timeline. The red area on the meters represents overmodulation of the sound and should be avoided if possible. To determine the maximum level you can safely use, click the Normalize button  .
.
.Stereo: This dropdown list contains all options for redirecting audio signals, such as a channel exchange (left interchanges with right, for example), or combining a two-channel stereo signal onto one mono channel.
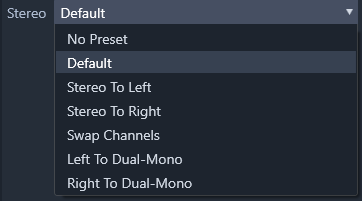
The Stereo drop-down menu with the channel routing options.
Normalize button : The normalize button examines the audio samples in the loaded sound to determine the amount of uniform increase that can be applied without overmodulation (harsh digital clipping) of any sample. Unlike compression and limiting, which modify the dynamics of audio material, normalization preserves dynamics by uniformly increasing (or decreasing) amplitude.
: The normalize button examines the audio samples in the loaded sound to determine the amount of uniform increase that can be applied without overmodulation (harsh digital clipping) of any sample. Unlike compression and limiting, which modify the dynamics of audio material, normalization preserves dynamics by uniformly increasing (or decreasing) amplitude.The waveform graph of the audio shows statically how the amplitude of the sound changes with time.
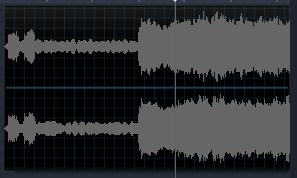
The waveform graph shows the change in audio levels over time. For stereo recordings, the graph is horizontally divided as shown here, with the left channel uppermost.
An alternative, dynamic view of the same audio material is given by the frequency spectrum display, which shows the changing spectral composition of the sound as it plays back.
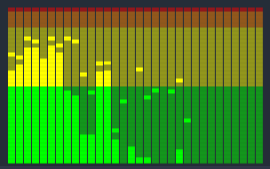
The frequency spectrum breaks down the audio signals by frequency bands, showing the sound level in each band. Lower frequencies are on the left. Peak levels are shown as a small box above each main bar for which a peak has been detected in the past few seconds.